Financial Dashboard for Power BI

Financial Dashboard for Power BI

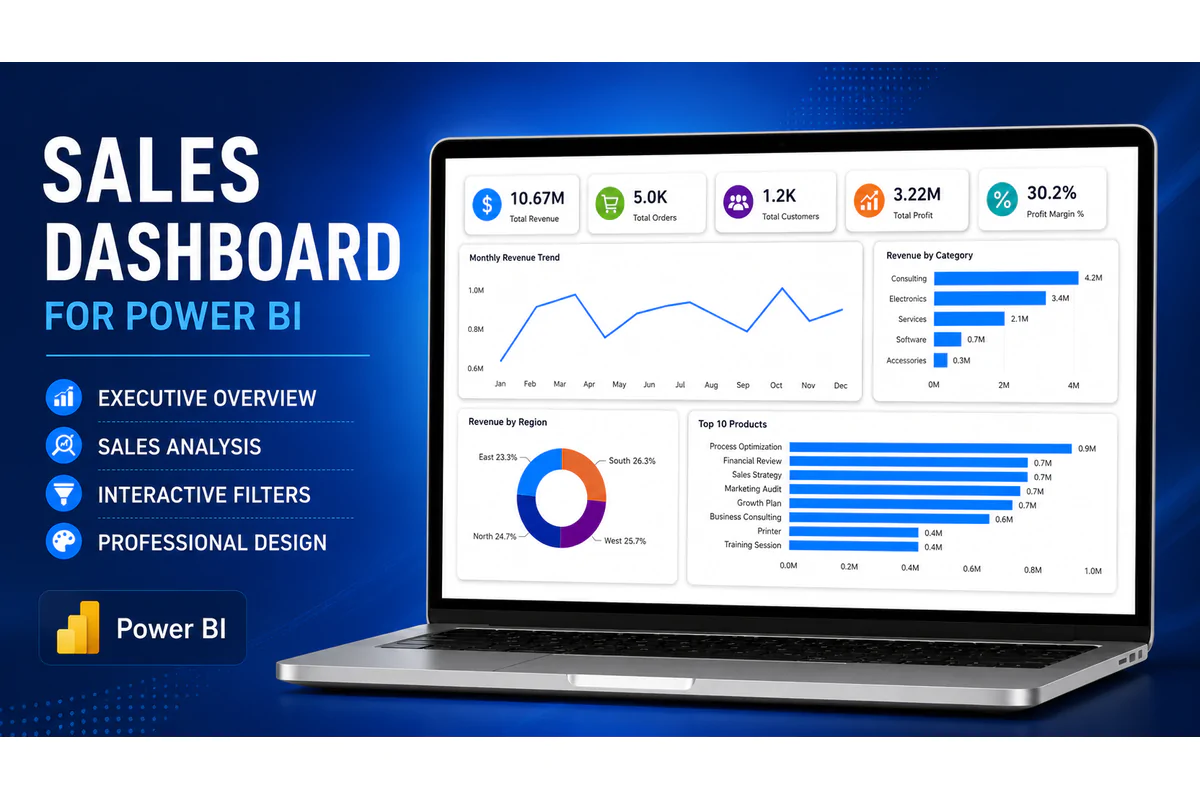
Analyze your business performance with this professional Power BI Financial Dashboard.

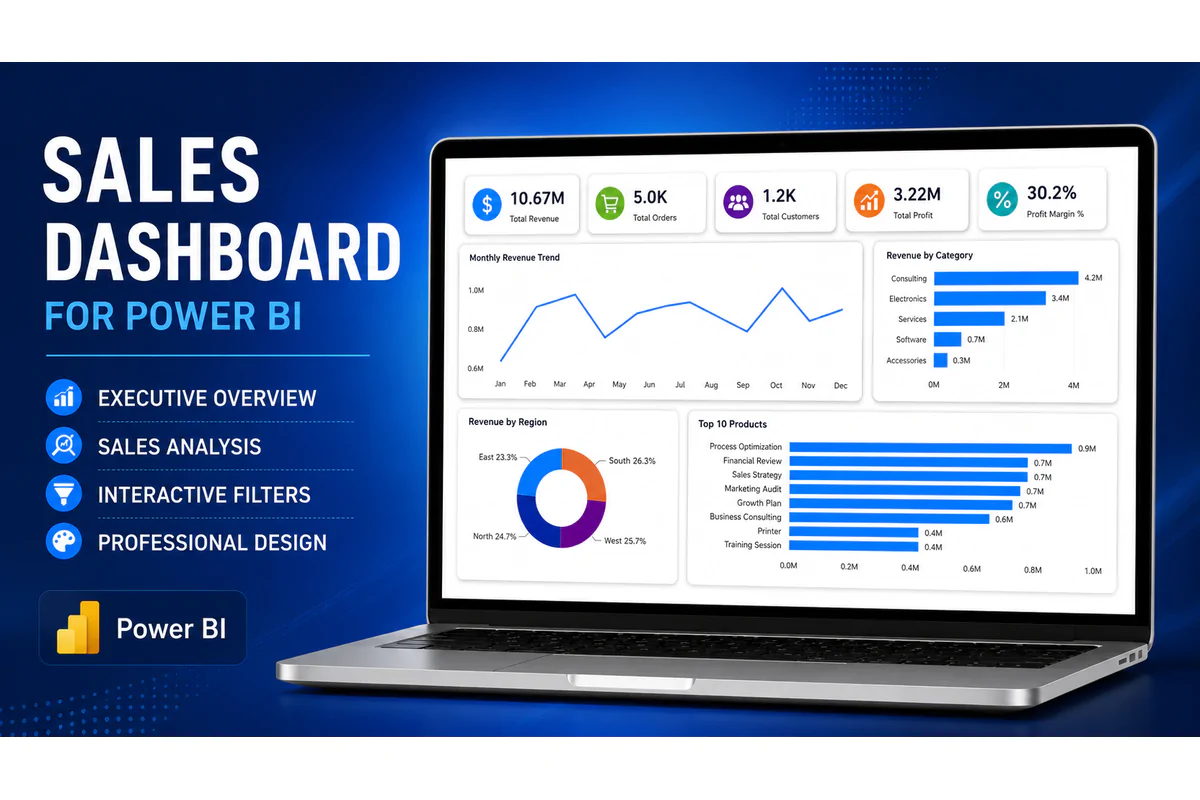
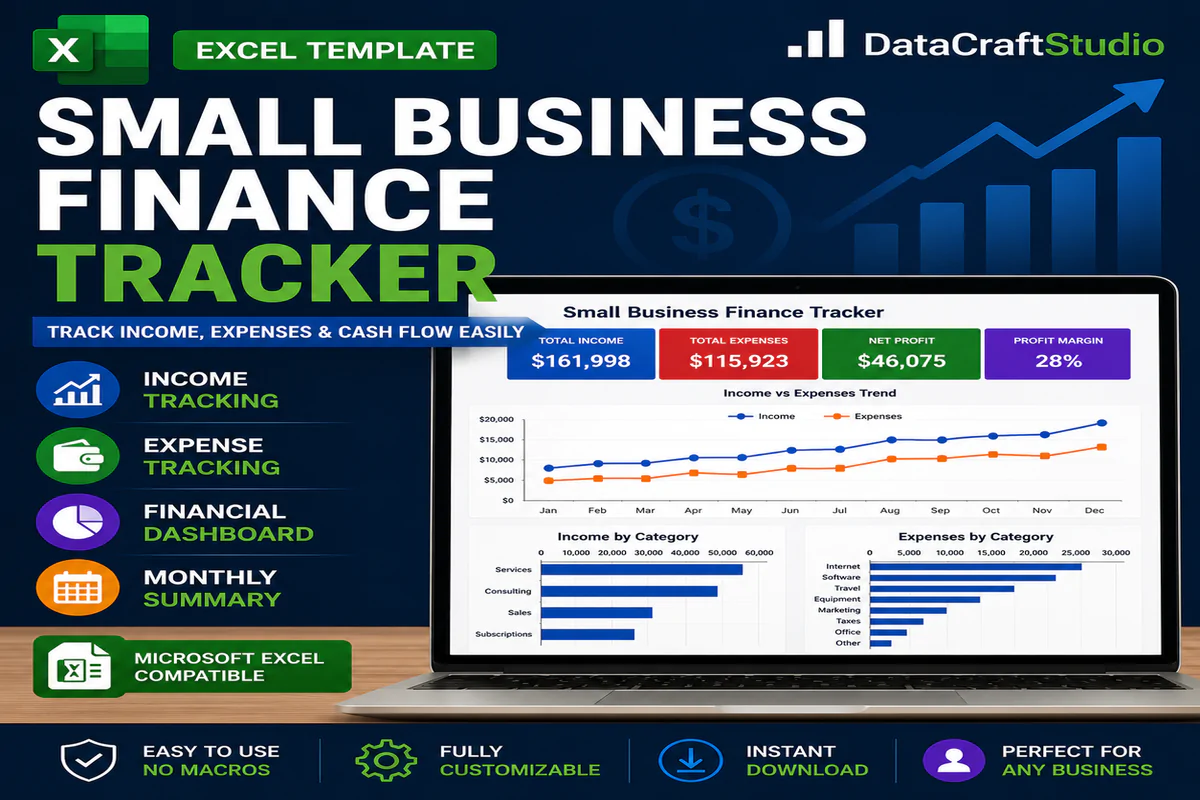
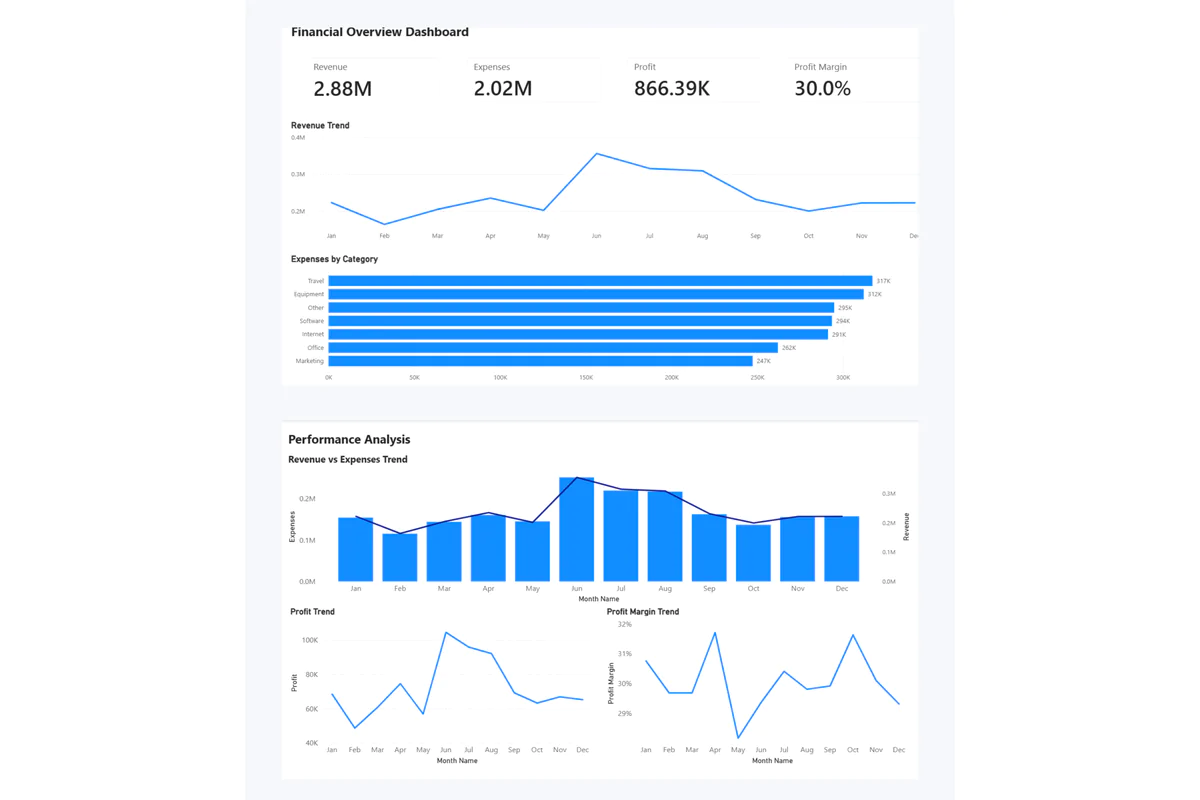
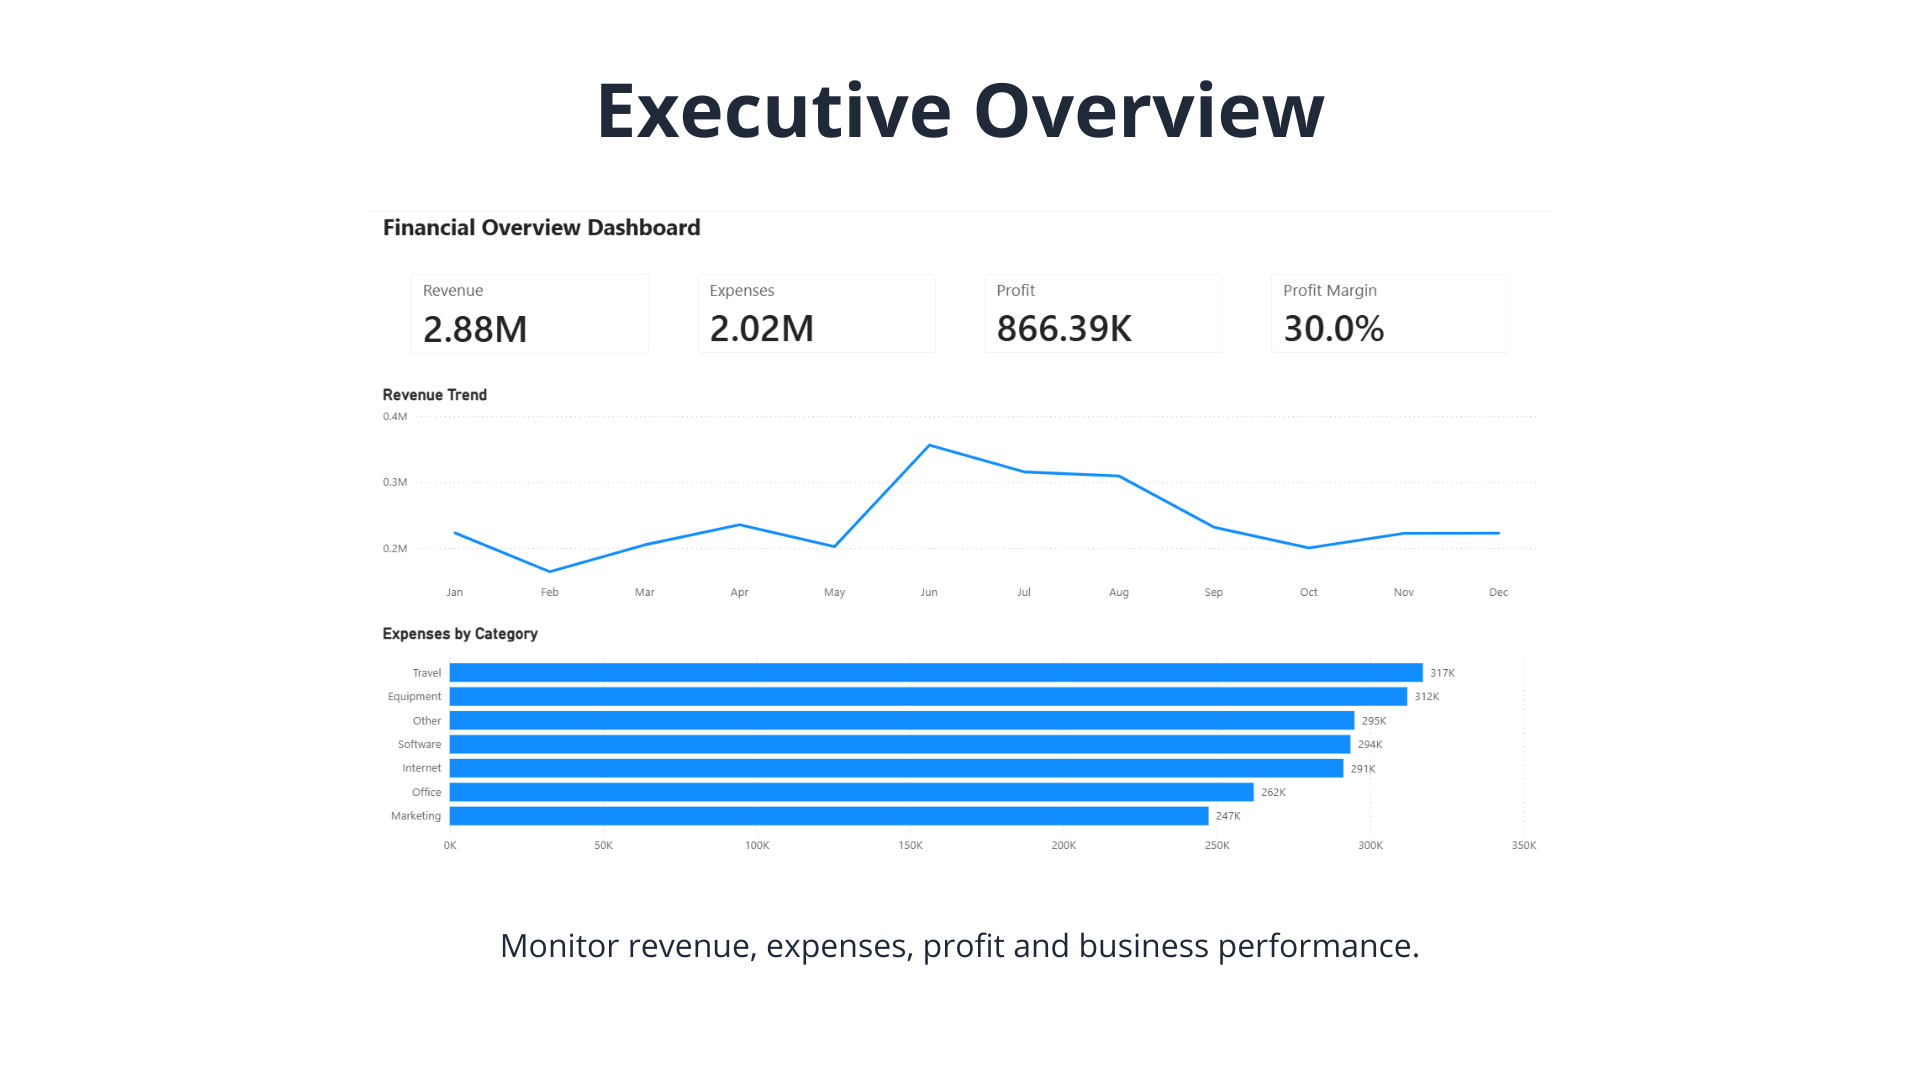
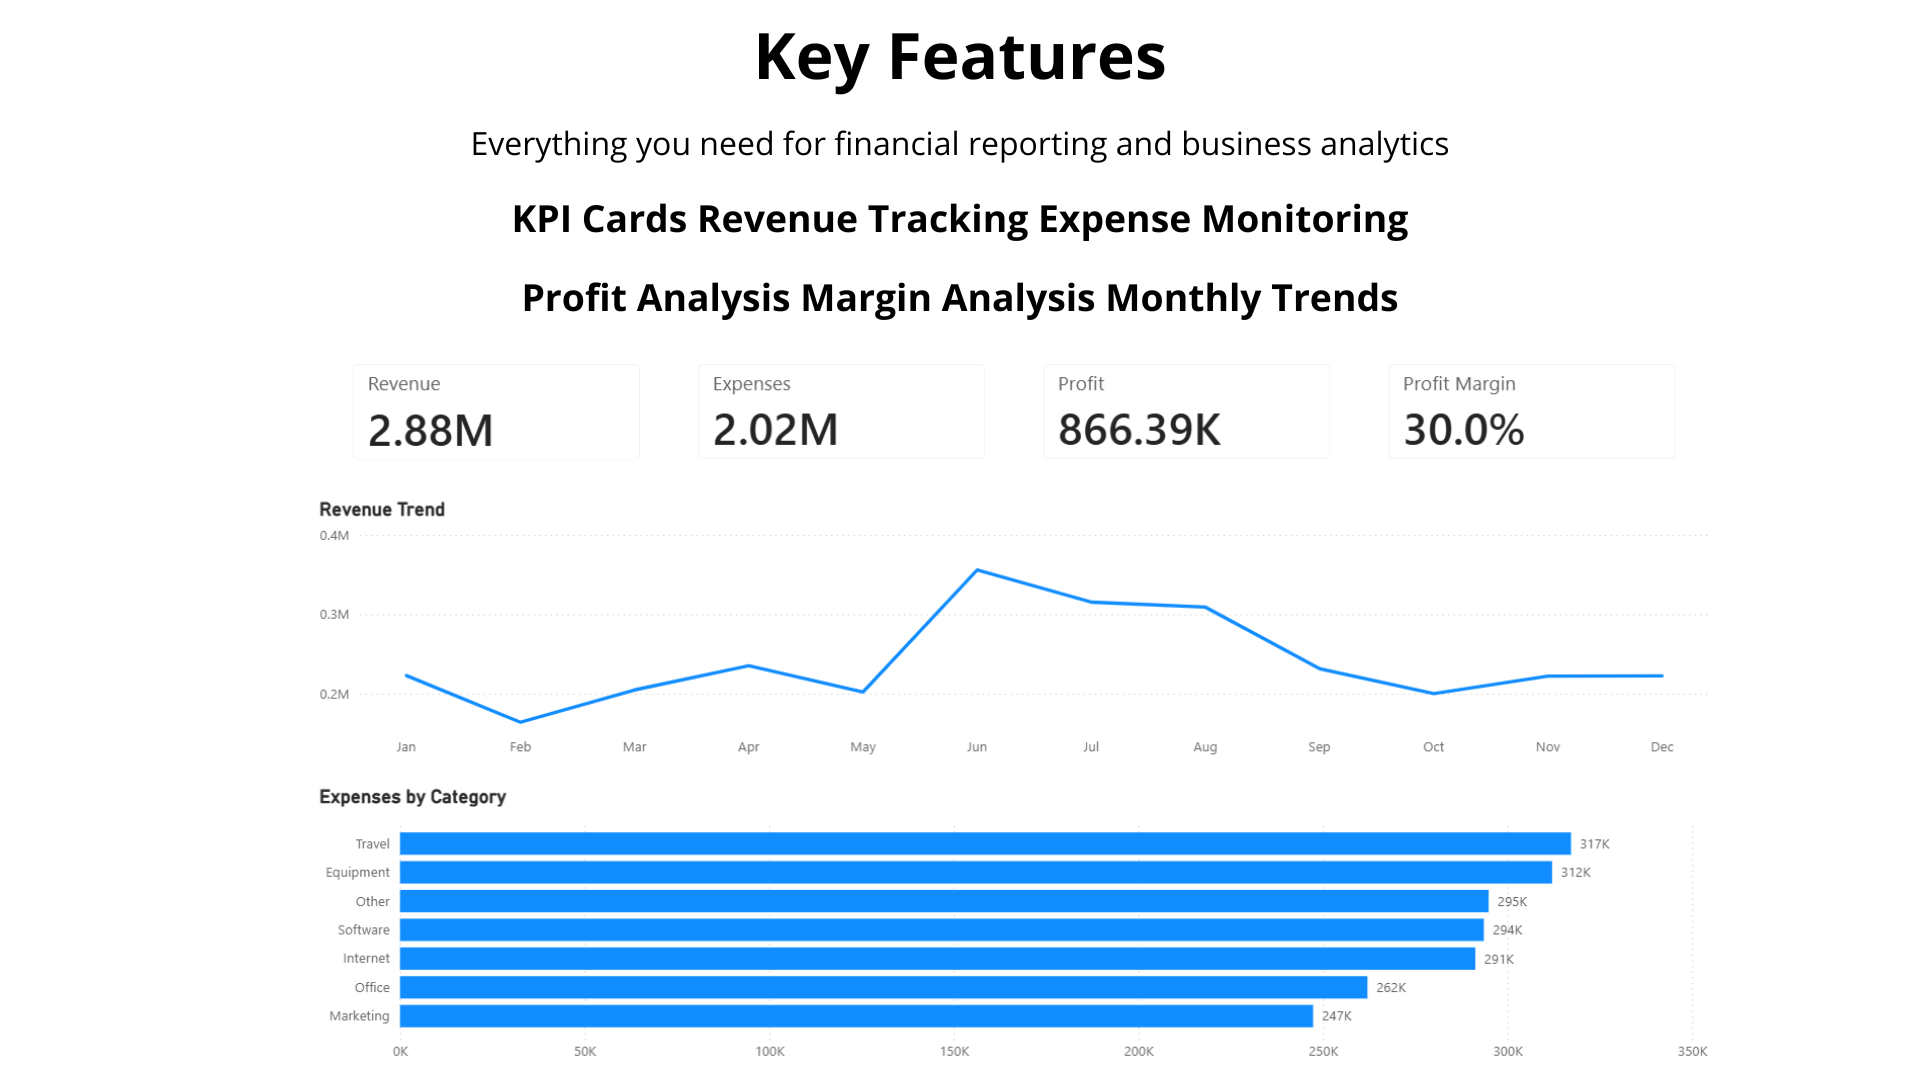
This interactive dashboard helps you visualize revenue, expenses, profit, and profit margin with powerful charts and KPIs. Designed for business owners, analysts, accountants, and managers who need fast financial insights without building reports from scratch.

Simply connect your data, refresh the report, and start analyzing your business performance.

Features

  • Executive financial dashboard
  • Revenue tracking
  • Expense analysis
  • Profit monitoring
  • Profit margin analysis
  • Interactive charts
  • KPI cards
  • Monthly trend analysis
  • Category analysis
  • Clean and professional design
  • Ready-to-use Power BI report

Dashboard Includes

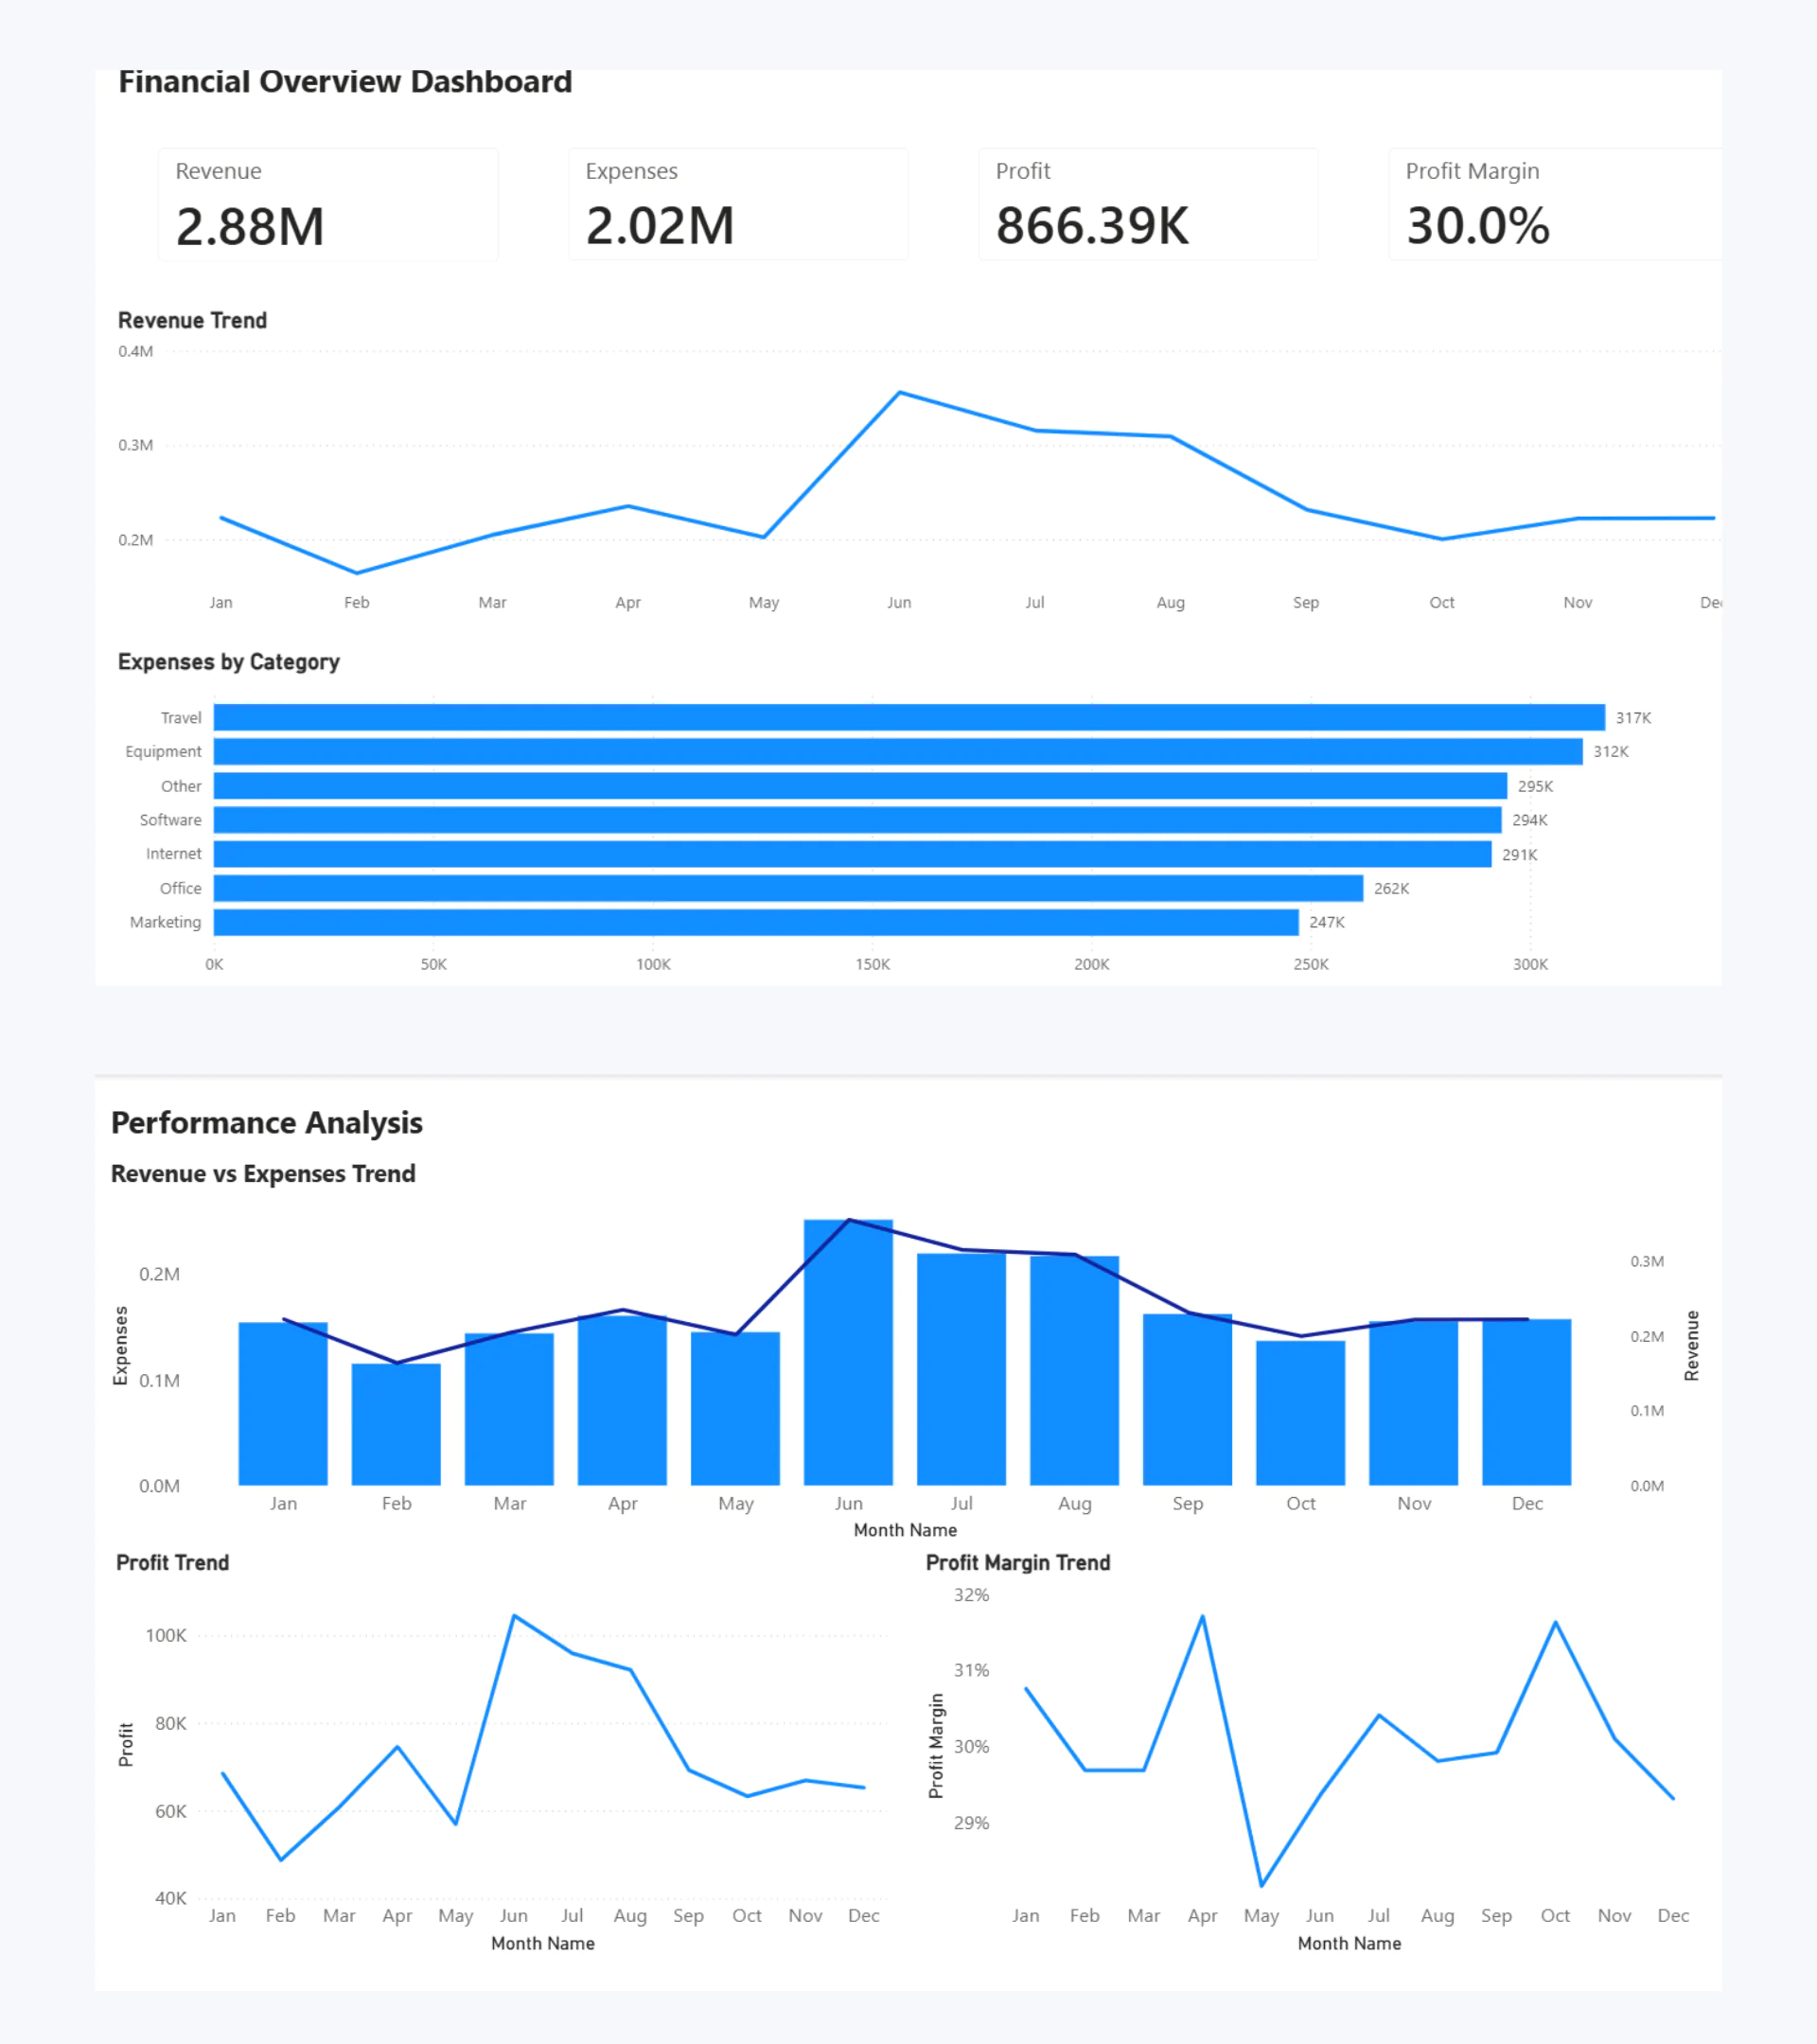
  • Revenue KPI
  • Expenses KPI
  • Profit KPI
  • Profit Margin KPI
  • Revenue Trend
  • Expenses by Category
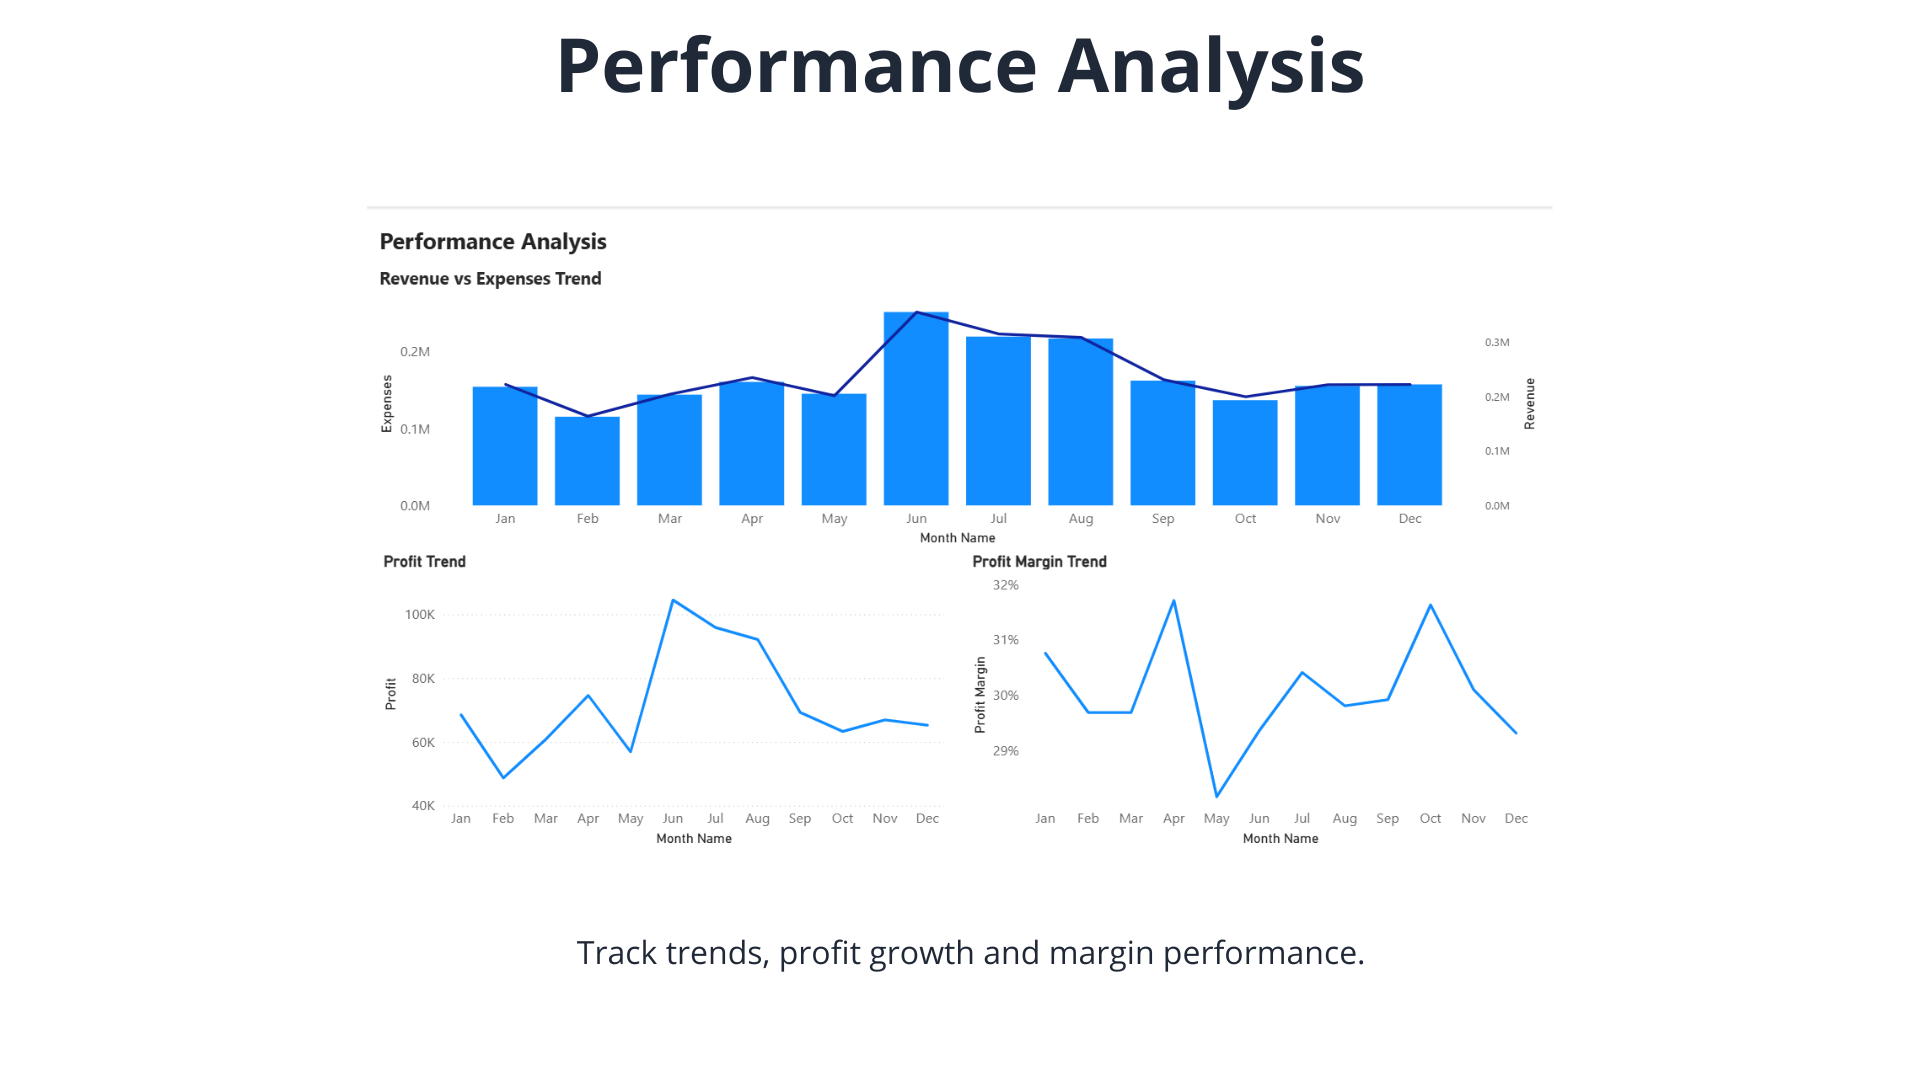
  • Revenue vs Expenses Analysis
  • Profit Trend
  • Profit Margin Trend

Perfect For

  • Small businesses
  • Financial analysts
  • Business owners
  • Accountants
  • Consultants
  • Managers
  • Power BI users

What's Included

  • Power BI Dashboard (.pbix)
  • Sample Dataset (.xlsx)
  • User Guide (PDF)

Requirements

  • Microsoft Power BI Desktop

Why Choose This Dashboard?

  • Professional business reporting
  • Easy to customize
  • Interactive visuals
  • Ready to use
  • Modern clean design
  • Save hours of report development
  • Instant download
License Option
Free Free
$1.62 $2.58
$16.19 $25.79
Quality checked by ZellMarket
Full Documentation
Future updates
Author Support

DataCraftStudio's items

Similar items